
Averages are useful because they’re simple. But this simplicity is also what makes them misleading.
Take Average Order Value (AOV) as an example.
Here’s data from an e-commerce brand with an AOV of 150€. If we dig deeper we see there’s a 100x spread between order values, from 10€ to 1000€.
We can visualize this distribution with a histogram. This shows that customers behave very differently and that there are very few “average” customers.
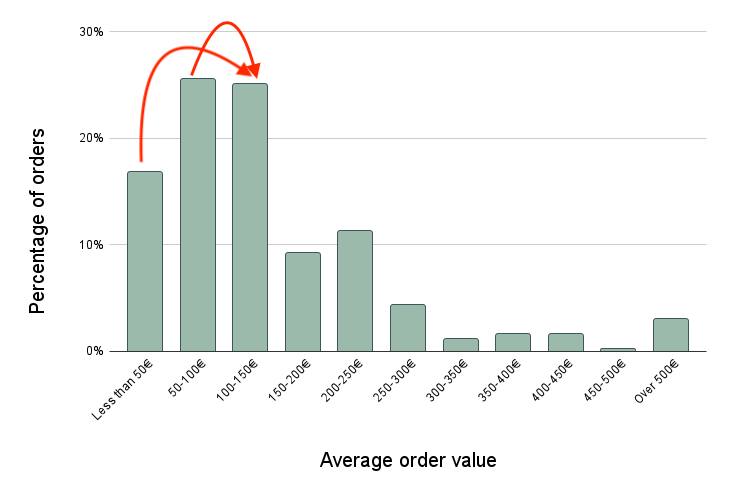
Companies will often set a goal of increasing AOV by X%. This approach doesn’t make much sense when you look at the actual buying behavior.
A better approach is to try moving customers from one “bucket” to the next.
In this example over 40% of customers buy for less than 100€. Can we move some of them to the 100€+ bucket by e.g. offering free delivery on orders over 100€?
Averages are useful and a good starting point. But to uncover real insights we must often look at the individual data points that make up the averages.