
Setting relevant targets is one of the hardest things marketers must do. Having contextual data makes it a lot easier. Here’s an example!
Conversion Rate (CVR) is a crucial metric for e-commerce brands because it directly impacts revenue. But what’s a good CVR? What should your target be?
Brands often struggle to answer these questions, because they lack context.
The scatter plot below shows data we’ve collected from 50+ stores. As you can see, there’s a negative correlation between Average Order Value (AOV) and CVR. The higher the AOV, the lower the expected CVR.
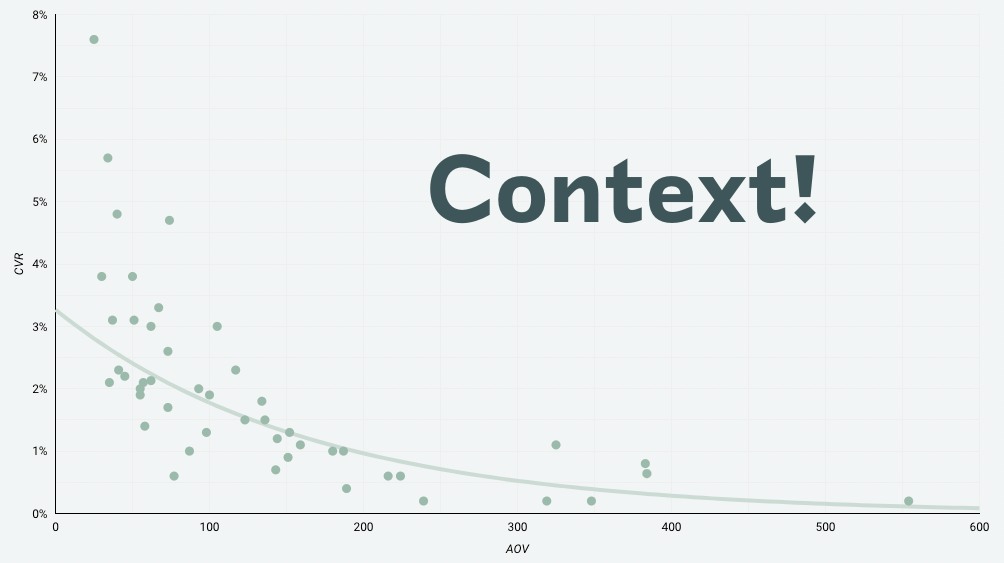
Using this data, we can plot an exponential decay function. This function tells us how individual stores measure up against the expected value. Stores that are above the curve perform better than average.
So a brand with a CVR of 2.5% and AOV of 40€ is actually not performing better than a brand with a CVR of 1.5% and AOV of 150€.
This applies to *all metrics*. Suppose that your Facebook CPMs have gone up by 50% YoY. That’s bad, right? Well, what if the average increase for similar companies is 70%? It’s all contextual.
Contextual data is a superpower that allows you to make better decisions. And we’re building tools to produce contextual insights for clients.